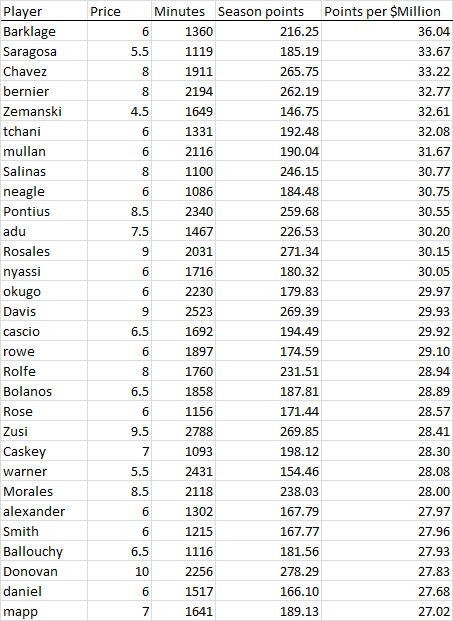
Here's the takeaways:
- The best use of these charts is to find cheap players who have the potential to give us decent returns when they are called upon to come off the bench.
- Another use for these charts is to find the expensive players who offer a decent return on investment.
- Defenders tend to have a higher PPM than midfielders who have a higher PPM than forwards.
- It looks as though there are several cheap options in defense that have a good PPM. This leads me to believe this is the area we should look to save a bit of cash for some attackers with lower PPM but higher season points. Look to pick up at least two of Woolard, McCarthy*, Tierney*, Korb*, Hedges, Hurtado, and Parke.
Defenders
Midfielders
Forwards


Hey what kind of formation do you usually use? 3-4-3?
ReplyDeleteI don't try to follow a specific formation. I tend to play my expensive players every week and then play whichever cheap players have a home game that week (unless it's against a top team and someone else is away to a poor team). I haven't checked yet, but my gut says defenders are more consistent week to week and score in a smaller variance than forwards and midfielders.
DeleteAmazing blog! Was looking for something like this for a long time, will be back for sure!
ReplyDeletesuggestion: always mention player's team, most of us are new to this...